Linear Regression:
- Linear regression is a statistical regression method which is used for predictive analysis.
- It is one of the very simple and easy algorithms which works on regression and shows the relationship between the continuous variables.
- It is used for solving the regression problem in machine learning.
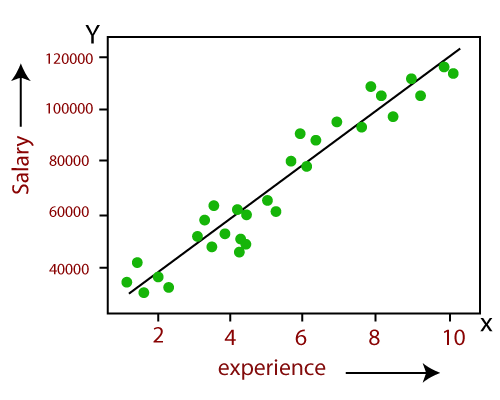
- Linear regression shows the linear relationship between the independent variable (X-axis) and the dependent variable (Y-axis), hence called linear regression.
- If there is only one input variable (x), then such linear regression is called simple linear regression. And if there is more than one input variable, then such linear regression is called multiple linear regression.
- The relationship between variables in the linear regression model can be explained using the below image. Here we are predicting the salary of an employee on the basis of the year of experience.
- Below is the mathematical equation for Linear regression:
Here, Y = dependent variables (target variables),
X= Independent variables (predictor variables),
a and b are the linear coefficients
Some popular applications of linear regression are:
- Analyzing trends and sales estimates
- Salary forecasting
- Real estate prediction
- Arriving at ETAs in traffic.
Logistic Regression:
- Logistic regression is another supervised learning algorithm which is used to solve the classification problems. In classification problems, we have dependent variables in a binary or discrete format such as 0 or 1.
- Logistic regression algorithm works with the categorical variable such as 0 or 1, Yes or No, True or False, Spam or not spam, etc.
- It is a predictive analysis algorithm which works on the concept of probability.
- Logistic regression is a type of regression, but it is different from the linear regression algorithm in the term how they are used.
- Logistic regression uses sigmoid function or logistic function which is a complex cost function. This sigmoid function is used to model the data in logistic regression. The function can be represented as:

- f(x)= Output between the 0 and 1 value.
- x= input to the function
- e= base of natural logarithm.
When we provide the input values (data) to the function, it gives the S-curve as follows:
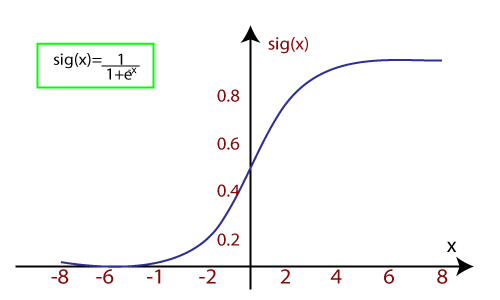
- It uses the concept of threshold levels, values above the threshold level are rounded up to 1, and values below the threshold level are rounded up to 0.
There are three types of logistic regression:
- Binary(0/1, pass/fail)
- Multi(cats, dogs, lions)
- Ordinal(low, medium, high)
Polynomial Regression:
- Polynomial Regression is a type of regression which models the non-linear dataset using a linear model.
- It is similar to multiple linear regression, but it fits a non-linear curve between the value of x and corresponding conditional values of y.
- Suppose there is a dataset which consists of data points which are present in a non-linear fashion, so for such case, linear regression will not best fit to those data points. To cover such data points, we need Polynomial regression.
- In Polynomial regression, the original features are transformed into polynomial features of given degree and then modeled using a linear model. Which means the data points are best fitted using a polynomial line.
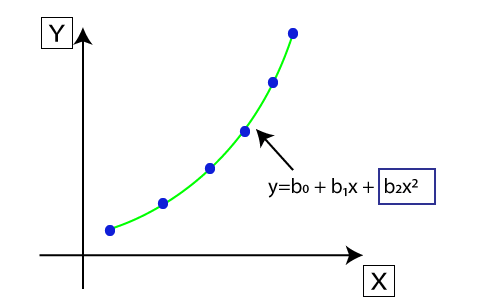
- The equation for polynomial regression also derived from linear regression equation that means Linear regression equation Y= b0+ b1x, is transformed into Polynomial regression equation Y= b0+b1x+ b2x2+ b3x3+.....+ bnxn.
- Here Y is the predicted/target output, b0, b1,... bn are the regression coefficients. x is our independent/input variable.
- The model is still linear as the coefficients are still linear with quadratic
Note: This is different from Multiple Linear regression in such a way that in Polynomial regression, a single element has different degrees instead of multiple variables with the same degree.
Support Vector Regression:
Support Vector Machine is a supervised learning algorithm which can be used for regression as well as classification problems. So if we use it for regression problems, then it is termed as Support Vector Regression.
Support Vector Regression is a regression algorithm which works for continuous variables. Below are some keywords which are used in Support Vector Regression:
- Kernel: It is a function used to map a lower-dimensional data into higher dimensional data.
- Hyperplane: In general SVM, it is a separation line between two classes, but in SVR, it is a line which helps to predict the continuous variables and cover most of the datapoints.
- Boundary line: Boundary lines are the two lines apart from hyperplane, which creates a margin for datapoints.
- Support vectors: Support vectors are the datapoints which are nearest to the hyperplane and opposite class.
In SVR, we always try to determine a hyperplane with a maximum margin, so that maximum number of datapoints are covered in that margin. The main goal of SVR is to consider the maximum datapoints within the boundary lines and the hyperplane (best-fit line) must contain a maximum number of datapoints. Consider the below image:
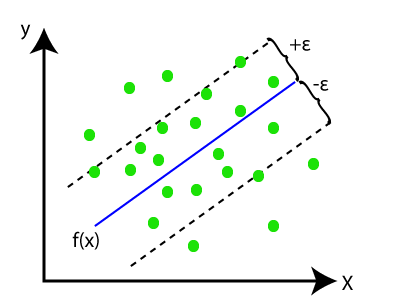
Here, the blue line is called hyperplane, and the other two lines are known as boundary lines.
Decision Tree Regression:
- Decision Tree is a supervised learning algorithm which can be used for solving both classification and regression problems.
- It can solve problems for both categorical and numerical data
- Decision Tree regression builds a tree-like structure in which each internal node represents the "test" for an attribute, each branch represent the result of the test, and each leaf node represents the final decision or result.
- A decision tree is constructed starting from the root node/parent node (dataset), which splits into left and right child nodes (subsets of dataset). These child nodes are further divided into their children node, and themselves become the parent node of those nodes. Consider the below image:
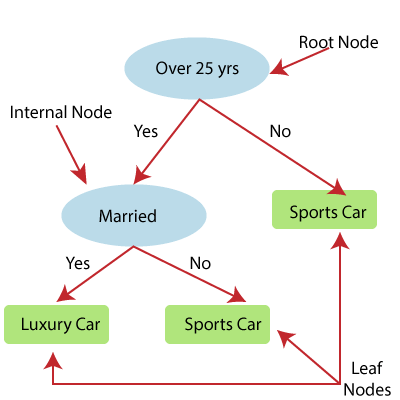
Above image showing the example of Decision Tee regression, here, the model is trying to predict the choice of a person between Sports cars or Luxury car.
- Random forest is one of the most powerful supervised learning algorithms which is capable of performing regression as well as classification tasks.
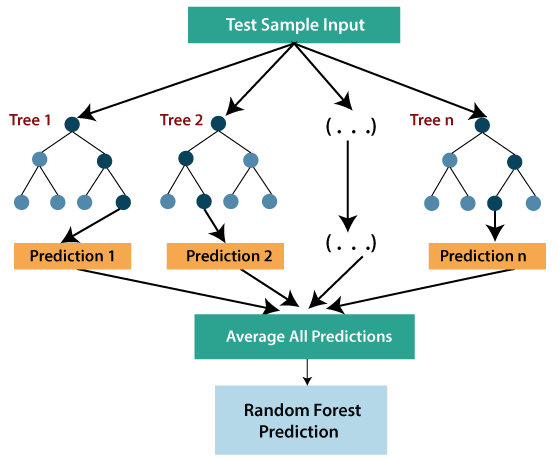
- The Random Forest regression is an ensemble learning method which combines multiple decision trees and predicts the final output based on the average of each tree output. The combined decision trees are called as base models, and it can be represented more formally as:
g(x)= f0(x)+ f1(x)+ f2(x)+....
- Random forest uses Bagging or Bootstrap Aggregation technique of ensemble learning in which aggregated decision tree runs in parallel and do not interact with each other.
- With the help of Random Forest regression, we can prevent Overfitting in the model by creating random subsets of the dataset.
Ridge Regression:
- Ridge regression is one of the most robust versions of linear regression in which a small amount of bias is introduced so that we can get better long term predictions.
- The amount of bias added to the model is known as Ridge Regression penalty. We can compute this penalty term by multiplying with the lambda to the squared weight of each individual features.
- The equation for ridge regression will be:

- A general linear or polynomial regression will fail if there is high collinearity between the independent variables, so to solve such problems, Ridge regression can be used.
- Ridge regression is a regularization technique, which is used to reduce the complexity of the model. It is also called as L2 regularization.
- It helps to solve the problems if we have more parameters than samples.
Lasso Regression:
- Lasso regression is another regularization technique to reduce the complexity of the model.
- It is similar to the Ridge Regression except that penalty term contains only the absolute weights instead of a square of weights.
- Since it takes absolute values, hence, it can shrink the slope to 0, whereas Ridge Regression can only shrink it near to 0.
- It is also called as L1 regularization. The equation for Lasso regression will be:

Comments
Post a Comment
"Welcome to my blog, where I, Sandeep Giri, share my passion for the Tech World. Join me on an exciting journey as we explore the latest trends, innovations, and advancements in the world of technology."